GIS reports and indicator layers
Contents
GIS reports and indicator layers#
This guide is for implementers configuring pre-built GIS report templates and area-level indicator visualizations.
GIS report templates#
Report templates are pre-built map configurations that combine data sources, aggregation methods, and visualization settings.
Template configuration#
Field |
What it means |
|---|---|
Name |
Template label (e.g., "Coverage Map") |
Data Source |
What type of records to visualize |
Aggregation Method |
How data is summarized (count, sum, average) |
Normalization |
Adjust for population or area size |
Color Scheme |
Visual palette |
Category |
Organizational grouping |
Report categories#
Organize templates by purpose:
Category |
Example Templates |
|---|---|
Coverage |
Program coverage by area, service point distribution |
Demographic |
Population by age group, gender distribution |
Disaster |
Affected areas, impact severity |
Performance |
Enrollment rates, payment completion |
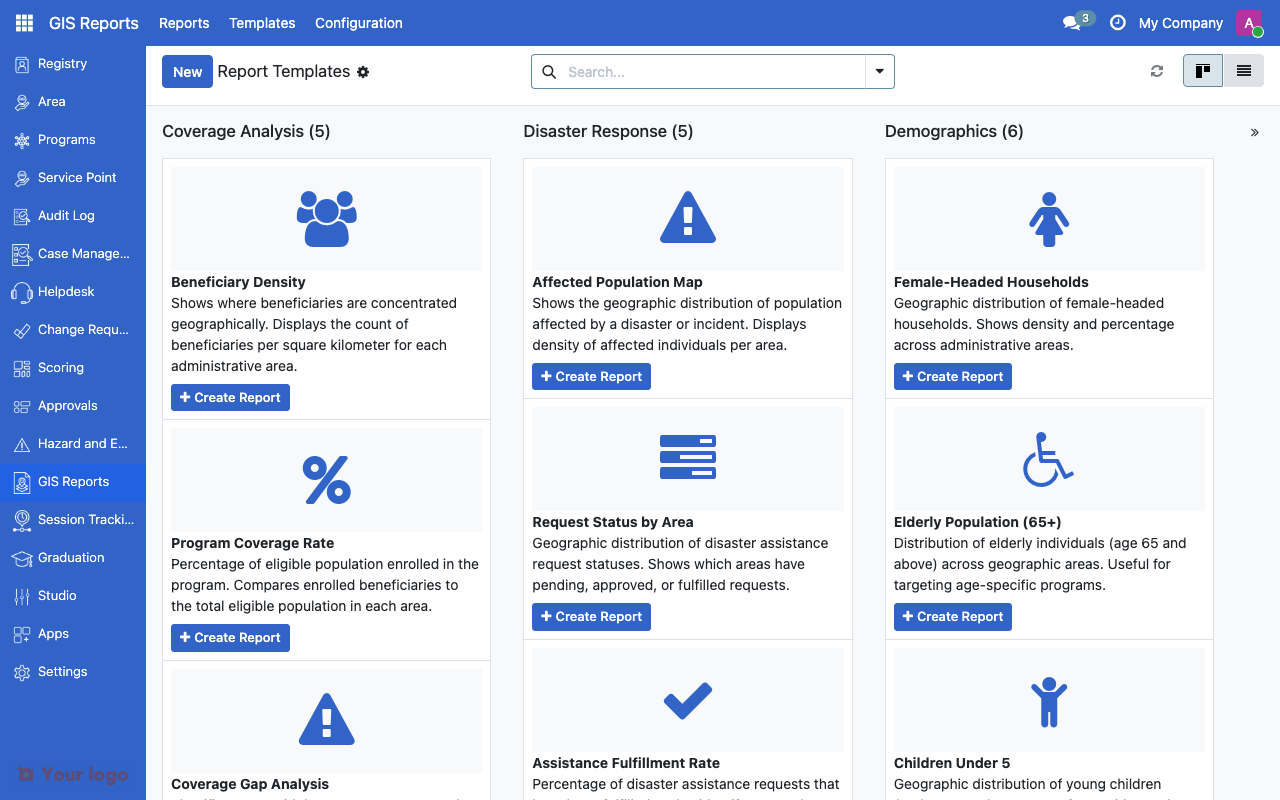
GIS report templates list showing pre-built map configurations.#
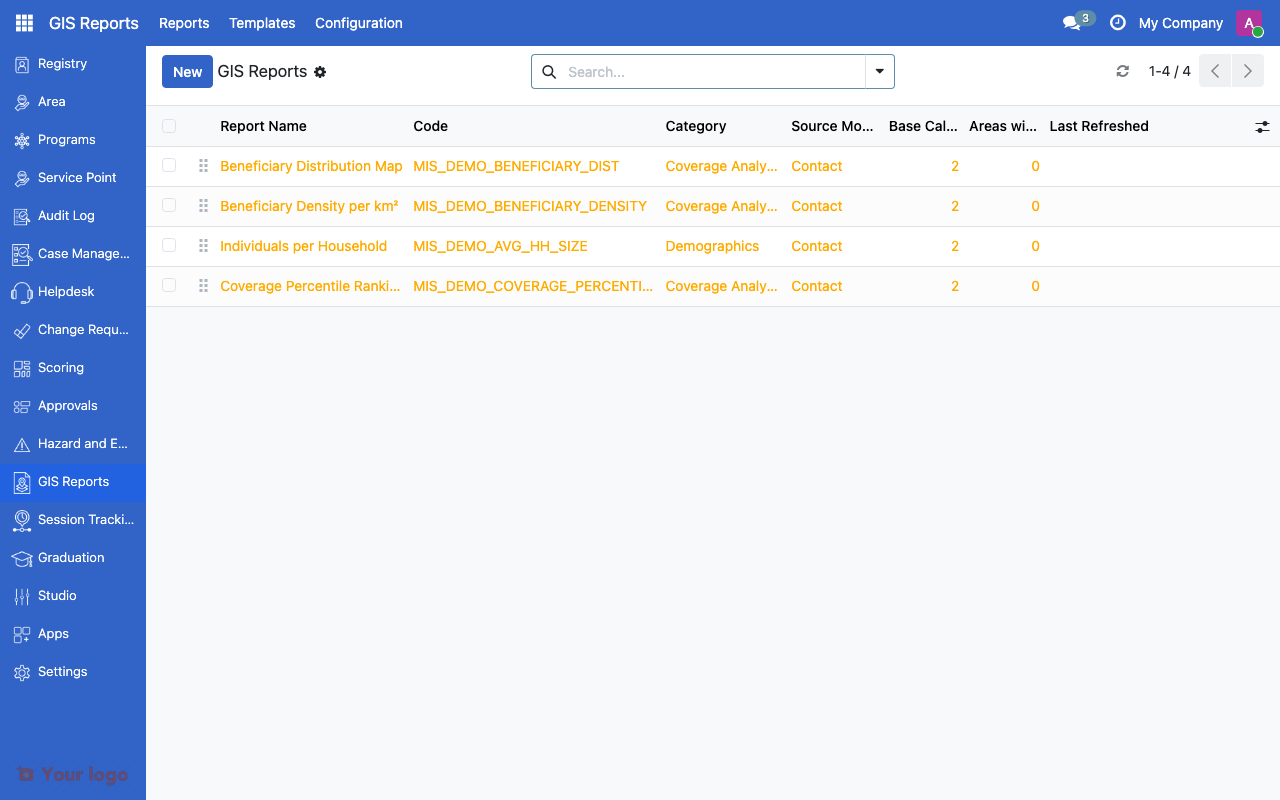
GIS reports list showing generated reports.#
Creating a report from a template#
Navigate to GIS Reports
Select a template
Configure report-specific parameters (program, date range, area scope)
Generate the report
View the map with the configured visualization
Indicator layers#
Indicator layers show CEL-based variables aggregated at the area level as choropleth maps.
Indicator layer configuration#
Field |
What it means |
|---|---|
Variable |
CEL variable to visualize |
Color Scale |
Color scheme for the visualization |
Classification Method |
Quantile, Equal Interval, or Manual Breaks |
Number of Classes |
Discrete color steps |
Manual Break Points |
Custom break values (for Manual method) |
Setting up an indicator layer#
Navigate to Settings > GIS Configuration > Indicator Layers
Click Create
Select the Variable (must be an area-level CEL variable)
Choose a Color Scale
Select the Classification Method
Set the number of classes or manual break points
Save
Indicator layer patterns#
Indicator |
Variable |
Classification |
Classes |
|---|---|---|---|
Poverty headcount |
poverty_rate |
Quantile |
5 |
Program coverage |
program_coverage_pct |
Manual: 25,50,75,90 |
4 |
Malnutrition rate |
malnutrition_under5 |
Equal Interval |
4 |
Are You Stuck?#
No variables available for indicator layers?
Indicator layers require area-level CEL variables. Check that variables are configured in Variables Overview and that they produce area-level aggregations.
Report template not generating?
Check that the source model has data and that the required parameters (program, area scope) are set.
How do I create a custom report template?
Contact your system administrator or developer. Custom templates require defining the data source query and aggregation logic.
Next steps#
GIS configuration overview - GIS fundamentals
Data layers - Data layer configuration
Variables Overview - Configure CEL variables for indicators