Data layers
Contents
Data layers#
This guide is for implementers configuring data overlays that display OpenSPP data on maps, including choropleth (color-by-value) visualizations.
Mental model#
Data layers come in two modes:
Mode |
What it does |
Example |
|---|---|---|
Basic |
Single-color markers or boundaries |
All service points shown as blue dots |
Choropleth |
Color varies by a numeric value |
Areas colored by poverty rate (green → red) |
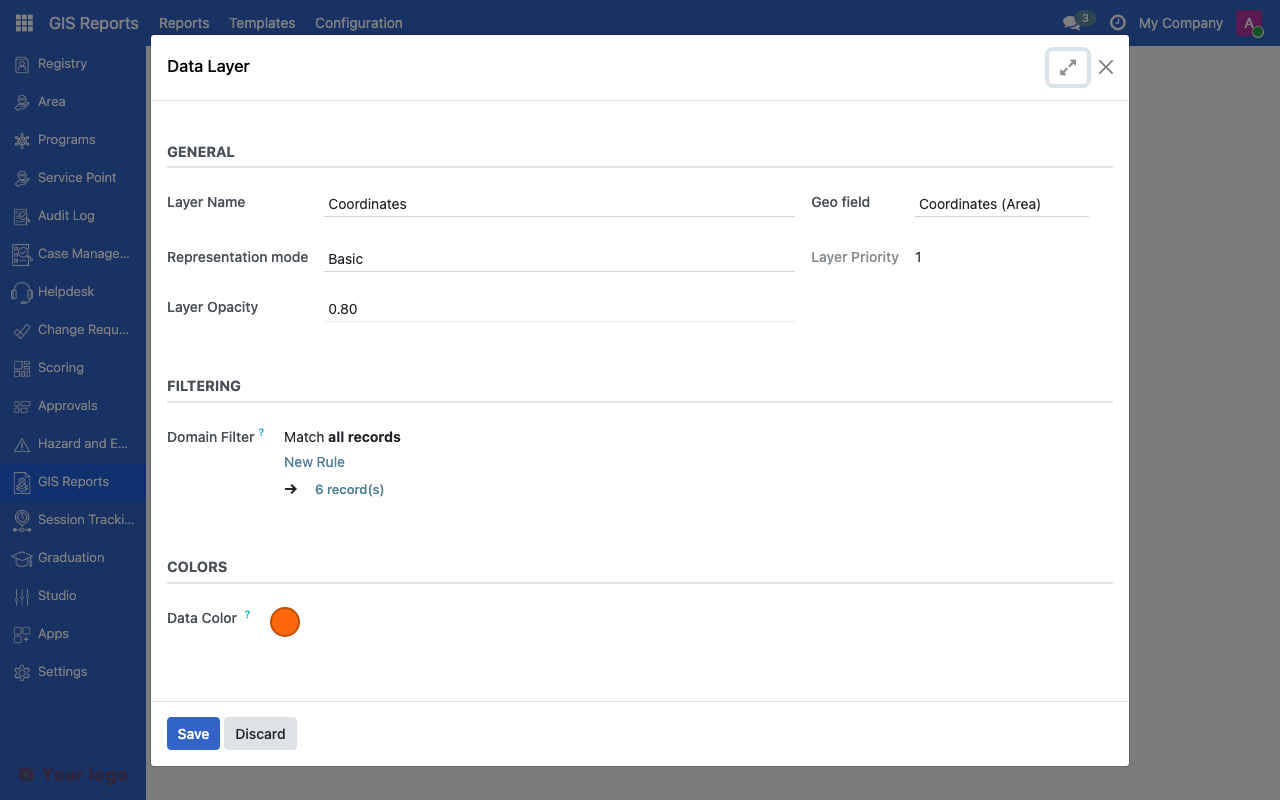
Data layer configuration#
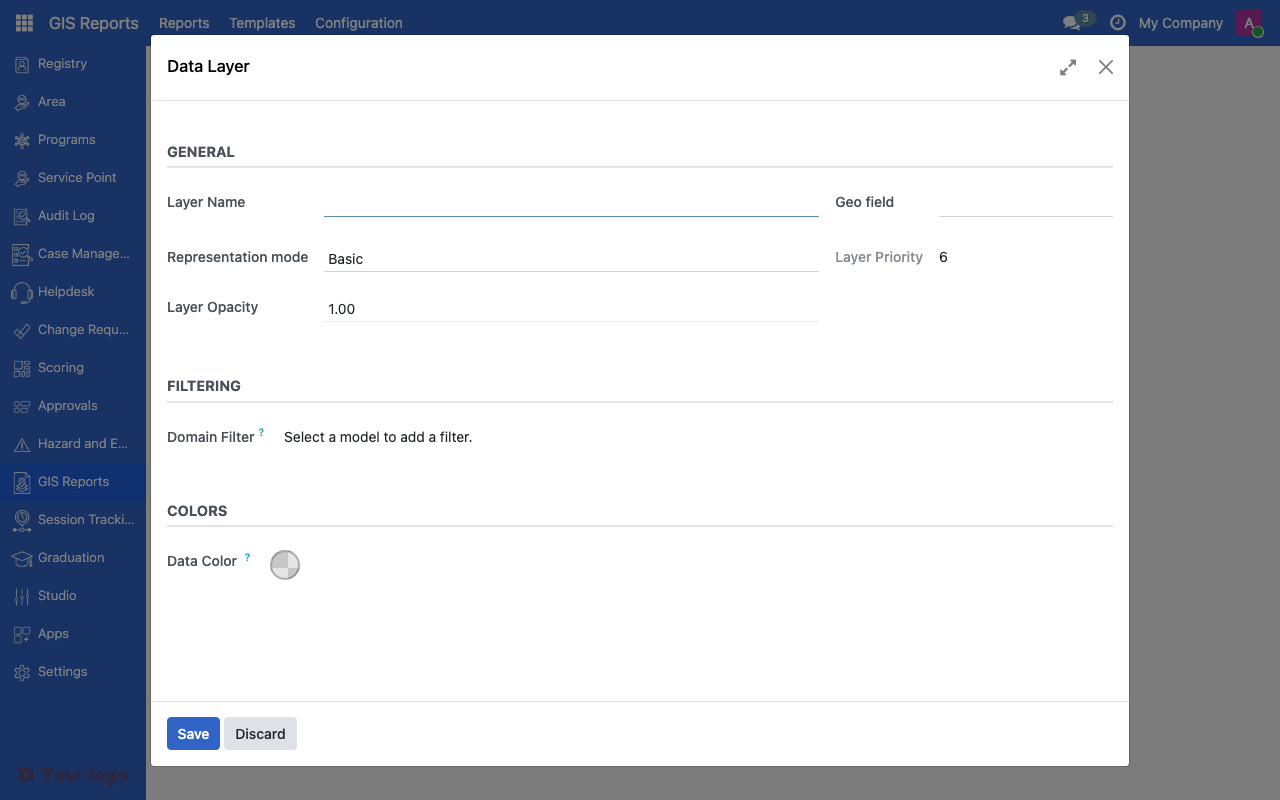
GIS data layers list showing geo field and representation mode.#
Common fields#
Field |
What it means |
|---|---|
Layer Name |
Display label (translatable) |
Geo Field |
Which location data to visualize (pin locations or area boundaries) |
Representation Mode |
Basic or Choropleth |
Sequence |
Layer stacking order (lower = drawn first) |
Active on Startup |
Show layer when map loads |
Opacity |
Transparency level (0% = invisible, 100% = solid) |
Basic mode#
Field |
What it means |
|---|---|
Data Color |
Single color for all features (selected via color picker) |
Choropleth mode#
Data layer form showing choropleth configuration options.#
Field |
What it means |
|---|---|
Value Field |
Numeric field that drives the color — must be Integer, Float, or Monetary type (e.g., poverty rate, beneficiary count) |
Color Ramp |
Pre-defined color gradient |
Min Value |
Minimum of the color range (auto-calculated if blank) |
Max Value |
Maximum of the color range (auto-calculated if blank) |
Classification Type |
How values are grouped into color classes |
Number of Classes |
How many color steps (3-10) |
Show Legend |
Display a legend on the map |
Legend Title |
Label for the legend |
Color ramps#
Ramp |
Best for |
|---|---|
Green-Yellow-Red |
Poverty rates, risk levels |
Red-Yellow-Green |
Positive metrics (coverage, compliance) |
Blue Scale |
Population density, rainfall |
Red Scale |
Emergency, critical metrics |
Purple Scale |
Health indicators |
Viridis |
General purpose, color-blind safe |
Custom |
Define your own low/high colors |
For custom ramps:
Low Value Color - Color for the minimum value (selected via color picker)
High Value Color - Color for the maximum value (selected via color picker)
Classification types#
Type |
How it works |
Best for |
|---|---|---|
Linear |
Equal-width intervals across the range |
Evenly distributed data |
Quantile |
Equal number of features per class |
Skewed distributions |
Manual Breaks |
You define the break points |
Known thresholds (e.g., poverty lines) |
For manual breaks, enter comma-separated values (e.g., 10,25,50,75,90).
Setting up a choropleth layer#
Step 1: Create the layer#
Navigate to Settings > GIS Configuration > Data Layers
Click Create
Enter the Layer Name
Select the Geo Field (the location or boundary data to visualize)
Set Representation Mode to "Choropleth"
Step 2: Configure the value field#
Select the Value Field - the numeric field that drives the coloring
Optionally set Min/Max Values (leave blank for auto-calculation)
Step 3: Choose classification#
Select a Color Ramp or use Custom
Choose the Classification Type (Linear, Quantile, or Manual)
Set the Number of Classes (5 is a good default)
For manual breaks, enter your break points
Step 4: Configure legend#
Enable Show Legend
Set a Legend Title (e.g., "Poverty Rate (%)")
Choropleth patterns#
Pattern 1: Poverty rate by area#
Setting |
Value |
|---|---|
Geo Field |
Area polygon |
Value Field |
Poverty rate (%) |
Color Ramp |
Green-Yellow-Red |
Classification |
Quantile, 5 classes |
Legend |
"Poverty Rate (%)" |
Pattern 2: Beneficiary count by area#
Setting |
Value |
|---|---|
Geo Field |
Area polygon |
Value Field |
Beneficiary count |
Color Ramp |
Blue Scale |
Classification |
Quantile, 4 classes |
Legend |
"Number of Beneficiaries" |
Pattern 3: Coverage percentage#
Setting |
Value |
|---|---|
Geo Field |
Area polygon |
Value Field |
Coverage (%) |
Color Ramp |
Red-Yellow-Green |
Classification |
Manual breaks: 25,50,75,90 |
Legend |
"Program Coverage (%)" |
Are You Stuck?#
Choropleth shows all areas the same color?
Check that the Value Field has different values across records. If all values are the same, there's nothing to differentiate.
Value field list is empty?
Only numeric fields (Integer, Float, or Monetary types) appear in the Value Field list. If your data is stored as text, it cannot be used for color-by-value maps.
Classification looks wrong?
Try switching between Linear and Quantile. Quantile works better for skewed data (a few outliers don't distort the scale). Use Manual Breaks when you have specific thresholds.
Legend not appearing?
Ensure Show Legend is enabled and Legend Title is set.
Layer not visible on the map?
Check Active on Startup and Opacity. An opacity of 0 makes the layer invisible.
Next steps#
GIS configuration overview - GIS fundamentals and base maps
GIS reports and indicator layers - GIS report configuration