View maps and generate reports
Contents
View maps and generate reports#
This guide is for users — field officers, program managers, and decision-makers who need to view registry data on a map or generate geographic reports.
What you will do#
Configure map layers, view registrant locations on an interactive map, add GPS coordinates to registrant records, and generate geographic coverage reports.
Before you start#
You need:
GIS Viewer access or higher to view maps and reports
Administrator access to configure map layers and data layers
The
spp_gismodule installed (ask your administrator to install it from the Apps menu)spp_registrant_gisinstalled if you need GPS coordinates on registrant recordsspp_gis_reportinstalled if you need geographic reportsA MapTiler API key (obtain one from the MapTiler Cloud documentation)
Steps#
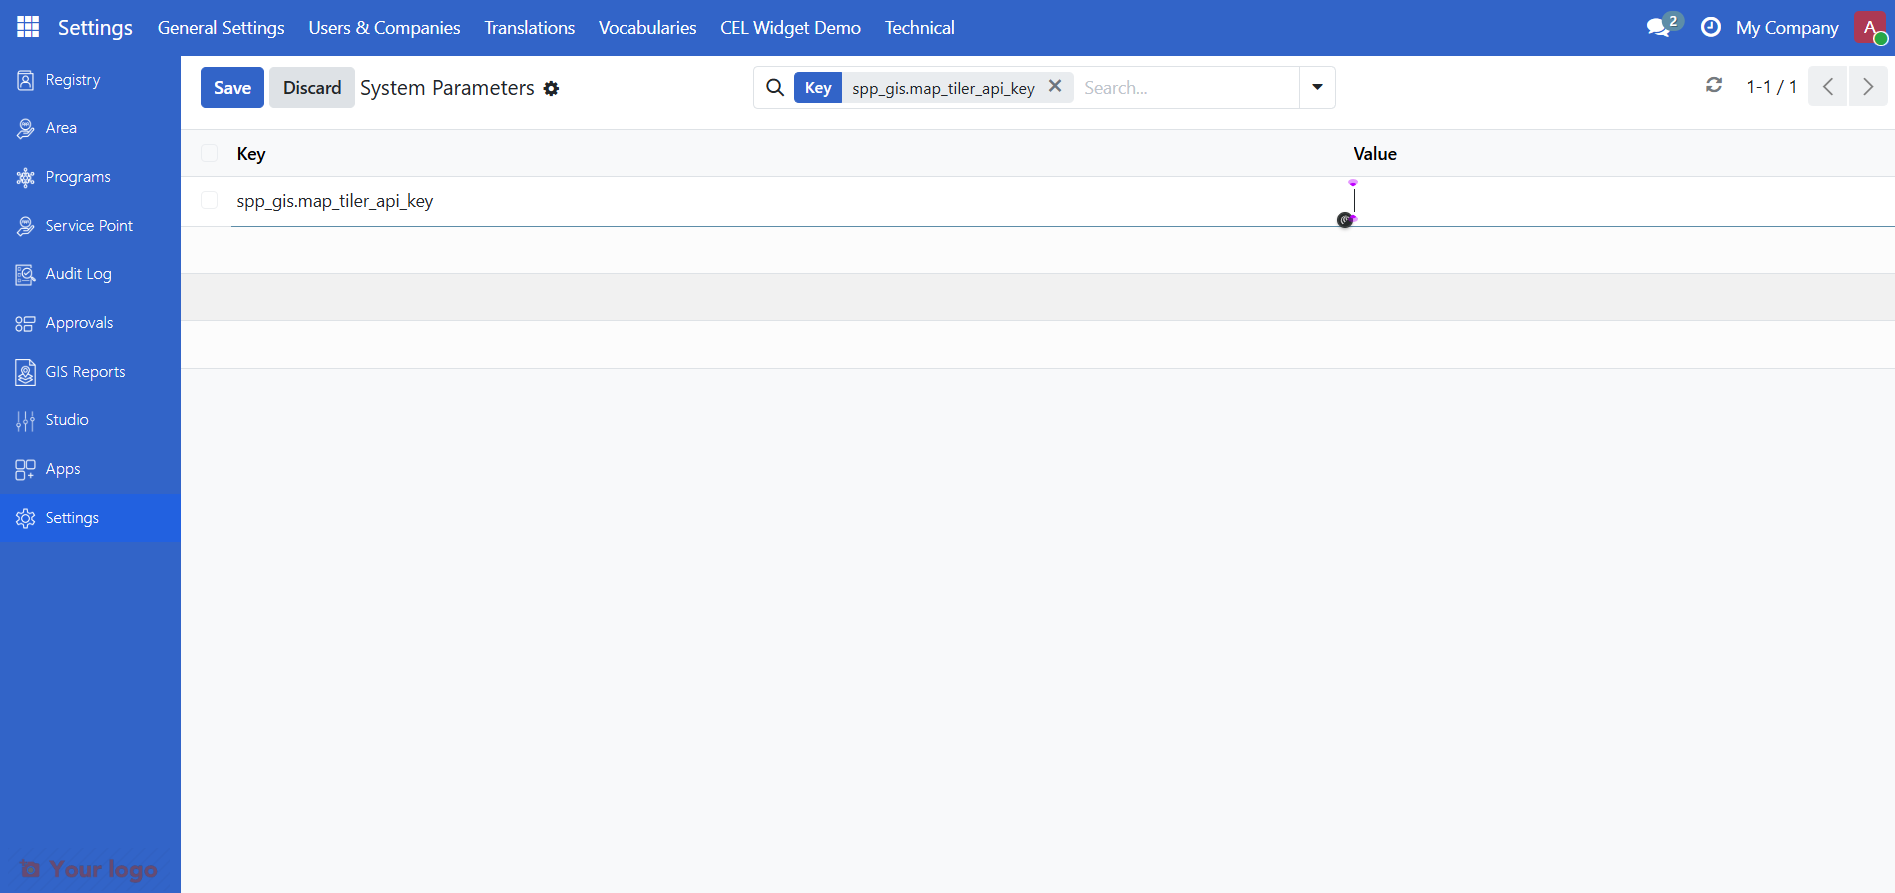
Step 1. Configure the MapTiler API key#
This is done once by an administrator before maps can display tiles.
Log in as an administrator.
Go to Settings and activate Developer Mode (scroll to the bottom of the Settings page and click Activate the developer mode).
Refresh the page, then go back to Settings > Technical > Parameters > System Parameters.
In the search bar, enter
spp_gis.map_tiler_api_keyand open the record.Enter your MapTiler API key in the Value field.
Click Save, then refresh your browser for the changes to take effect.
Warning
Keep your API key secure. Do not share it publicly or store it in version control systems.
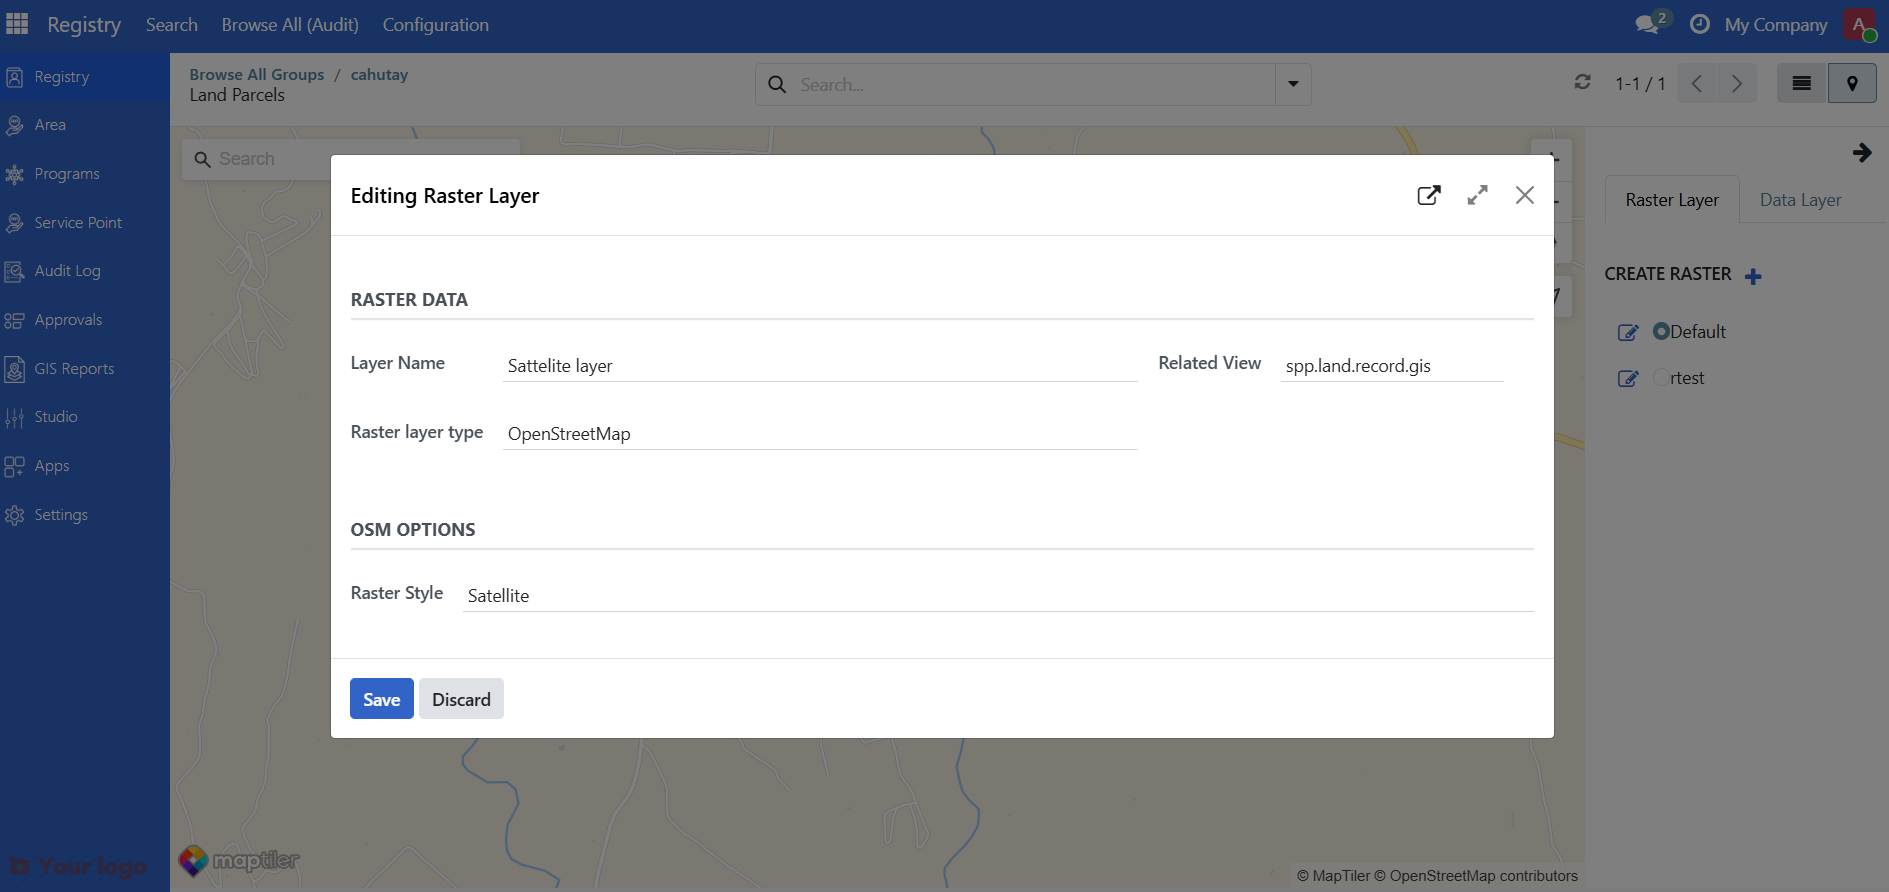
Step 2. Configure the raster layer#
Set up which map tiles appear as the background. You need an existing group with at least one land parcel defined before starting.
Go to Registry > Groups and open an existing group.
Click the Land Parcels smart button, then click the Pin icon to open the map.
A Default layer is already provided. You can use it as-is or add a custom raster layer.
To add a new raster layer, click +, fill in the required information, and click Save.
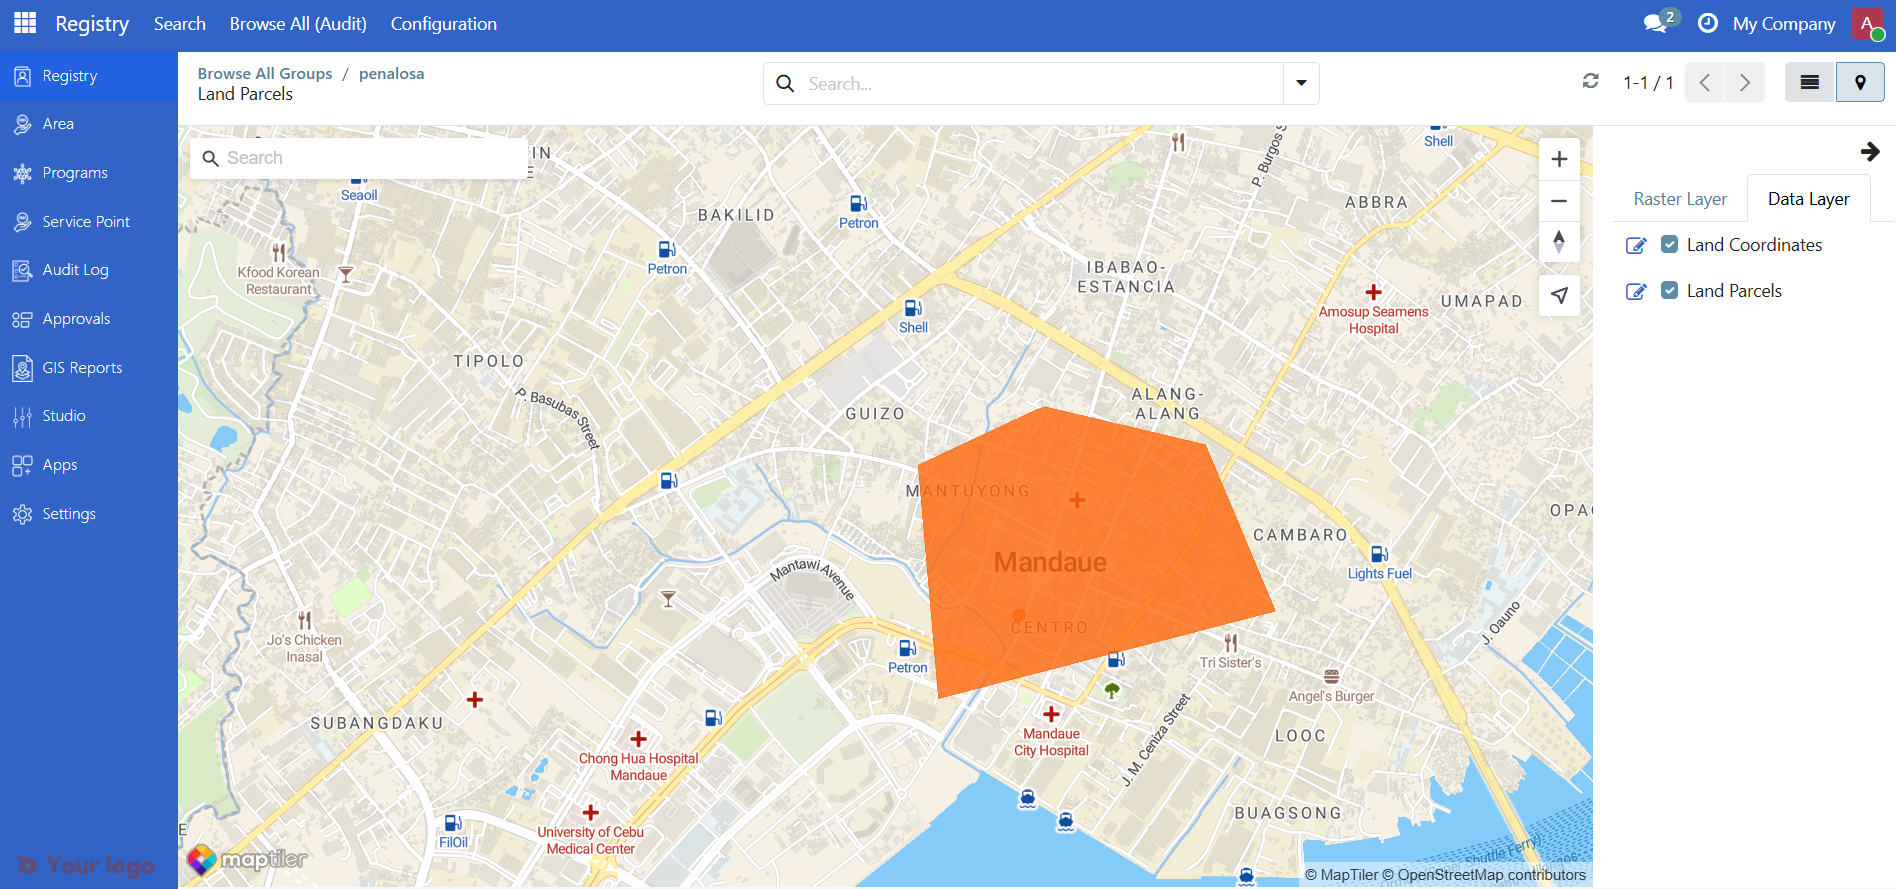
Step 3. Configure and view data layers in the registry#
Data layers control which records and fields appear on the map. Requires the spp_registrant_gis module.
From the map view (Pin icon), click the Data Layer tab.
Click the Edit icon to configure how data is displayed on the map.
Click Save to apply the changes.
Check the boxes beside Land Coordinates or Land Parcels to display the associated land or farm data for the registrant on the map.
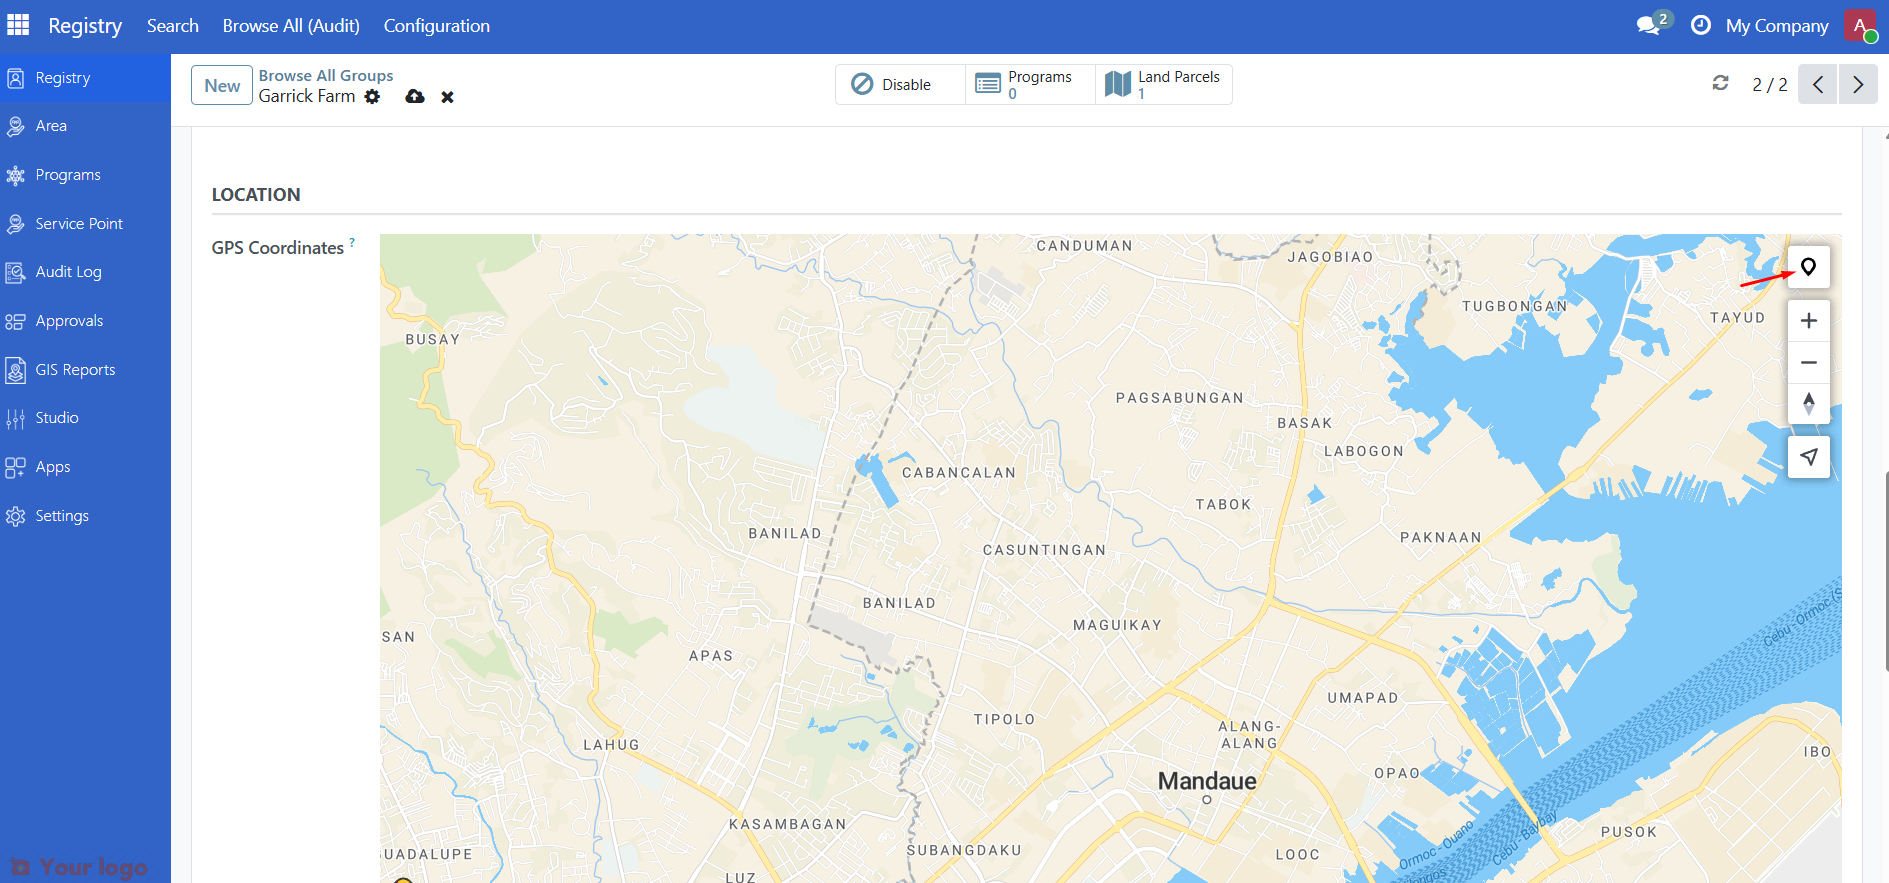
Step 4. Add GPS coordinates to a registrant#
Requires the spp_registrant_gis module.
Go to Registry > Groups (or Individuals) and open a registrant record.
Click the Land Parcels smart button to open the map.
Note
For an individual registrant, click the Profile tab and scroll to the Location section instead.
Click the tool icon just above the zoom + button to activate the drawing tool.
Coordinates: click anywhere on the map to pin the location.
Polygon: click to draw a shape point by point; double-click the final point to close the shape.
Click Save.
Step 5. Configure and view data layers in an area#
Make sure you have existing area data before starting.
Go to Area and click the Pin icon to open the map view.
In the Raster Layer tab, click + to add a new raster layer if needed. Default layers are already provided.
In the Data Layer tab, click the Edit button to configure how data is displayed on the map.
Use the map controls to zoom in and out and switch between layers.
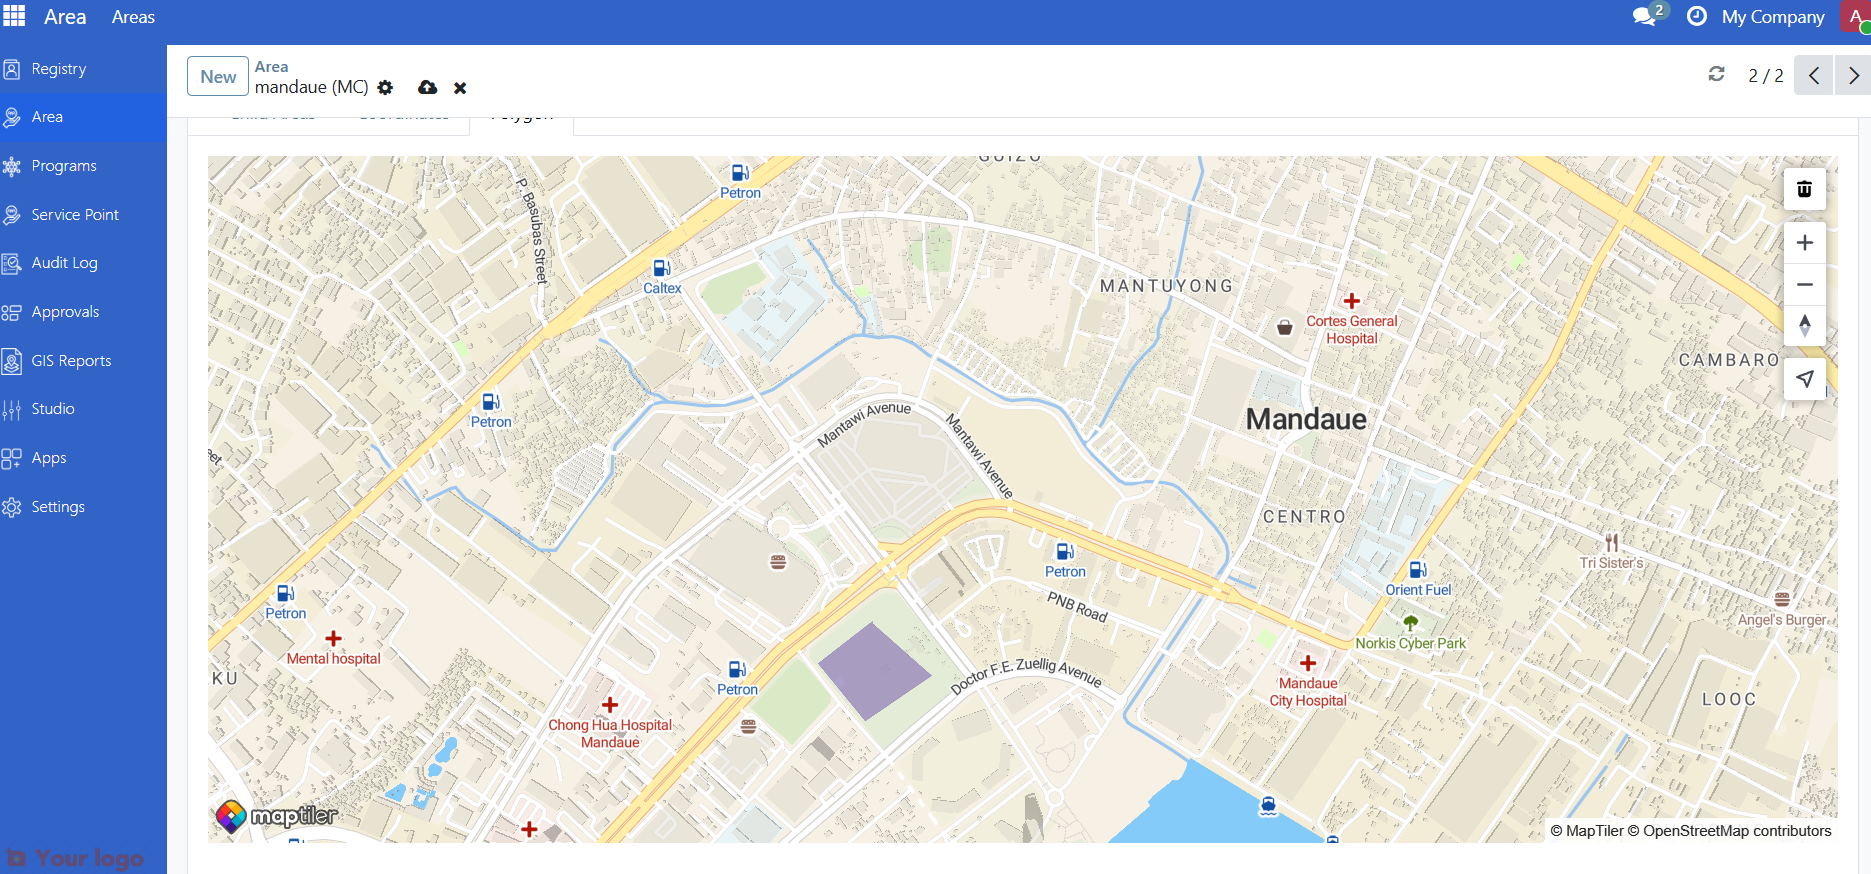
To define the area's location in the map, from Area list view, click on an area record and scroll down and click the Coordinates or Polygon tab.
Click the tool icon just above the zoom + button to activate the drawing tool.
Coordinates: click anywhere on the map to pin the location.
Polygon: click to draw a shape point by point; double-click the final point to close the shape.
Click Save.
Are you stuck?#
The map is blank or shows no tiles.
API key may have not been defined properly from step 1.
The Raster layer may not be configured or the tile server URL is unreachable.
Registrant coordinates are not showing on the map.
Make sure
spp_registrant_gisis installed and that coordinates have been entered on the registrant's Profile tab.Records without coordinates do not appear as map pins.
I cannot access GIS Configuration.
Access to configuration menus is restricted to administrators and GIS managers.
Ask your system administrator to assign you the appropriate role.