Scoring Framework Overview
Contents
Scoring Framework Overview#
This guide is for implementers configuring scoring systems in OpenSPP. You should be comfortable with logic builders like CommCare or Kobo, but you don't need to write Python code.
Mental Model#
Think of scoring in OpenSPP as having three main parts:
Scoring Models - The blueprint that defines what to measure and how to calculate
Indicators - Individual data points that contribute to the score (e.g., roof material, household size)
Thresholds - Score ranges that classify households (e.g., 0-30 = "Extremely Poor")
When you score a household, OpenSPP:
Reads field values from the household record (roof material, assets, etc.)
Converts each value to a numeric score using the indicator configuration
Combines indicator scores using weights
Compares the total score against thresholds to assign a classification
How Scoring Works#
Step 1: Create a Scoring Model#
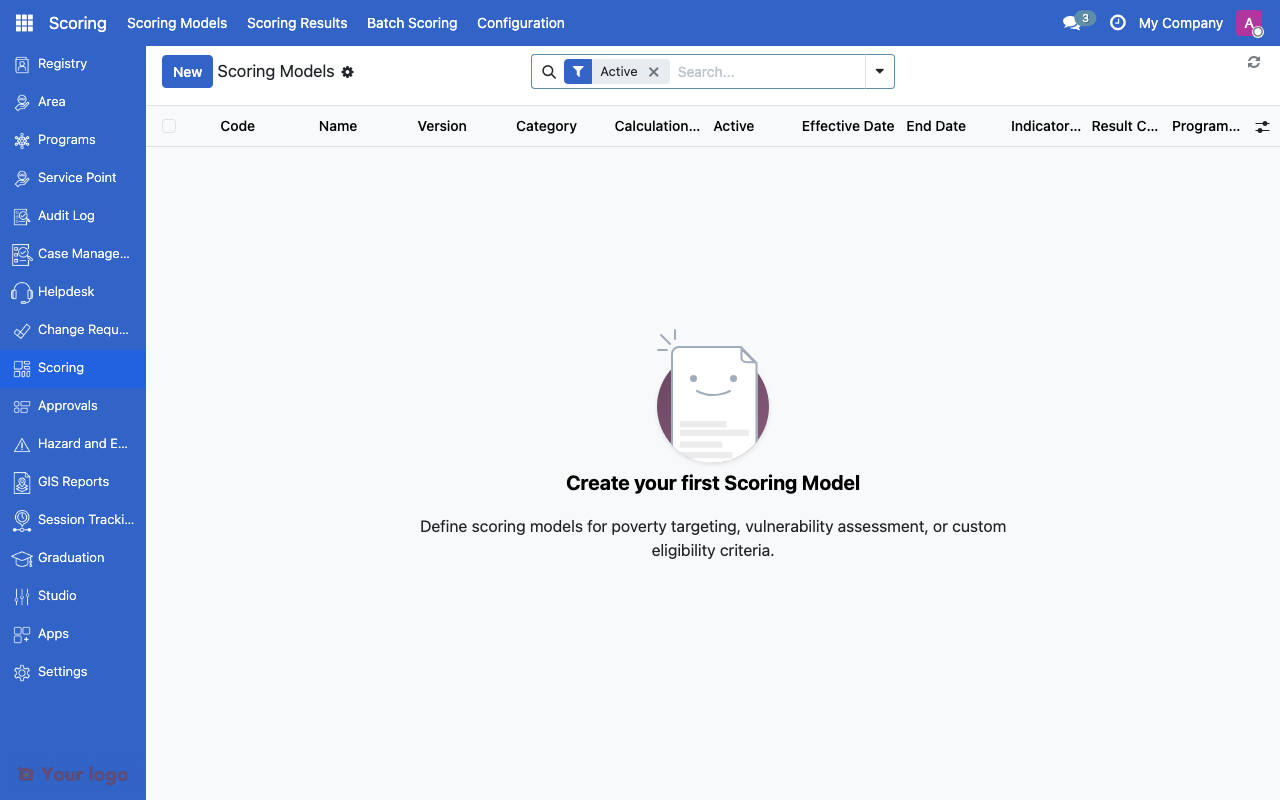
Scoring models list showing model name, category, and calculation method.#
A scoring model is your methodology container. It includes:
Field |
What It Means |
|---|---|
Name |
Human-readable (e.g., "2024 PMT - Urban") |
Code |
Unique identifier (e.g., "PMT_2024_URBAN") |
Category |
Purpose (poverty, vulnerability, eligibility) |
Calculation Method |
How to combine indicators (weighted_sum, cel_formula) |
Active |
Only active models can score households |
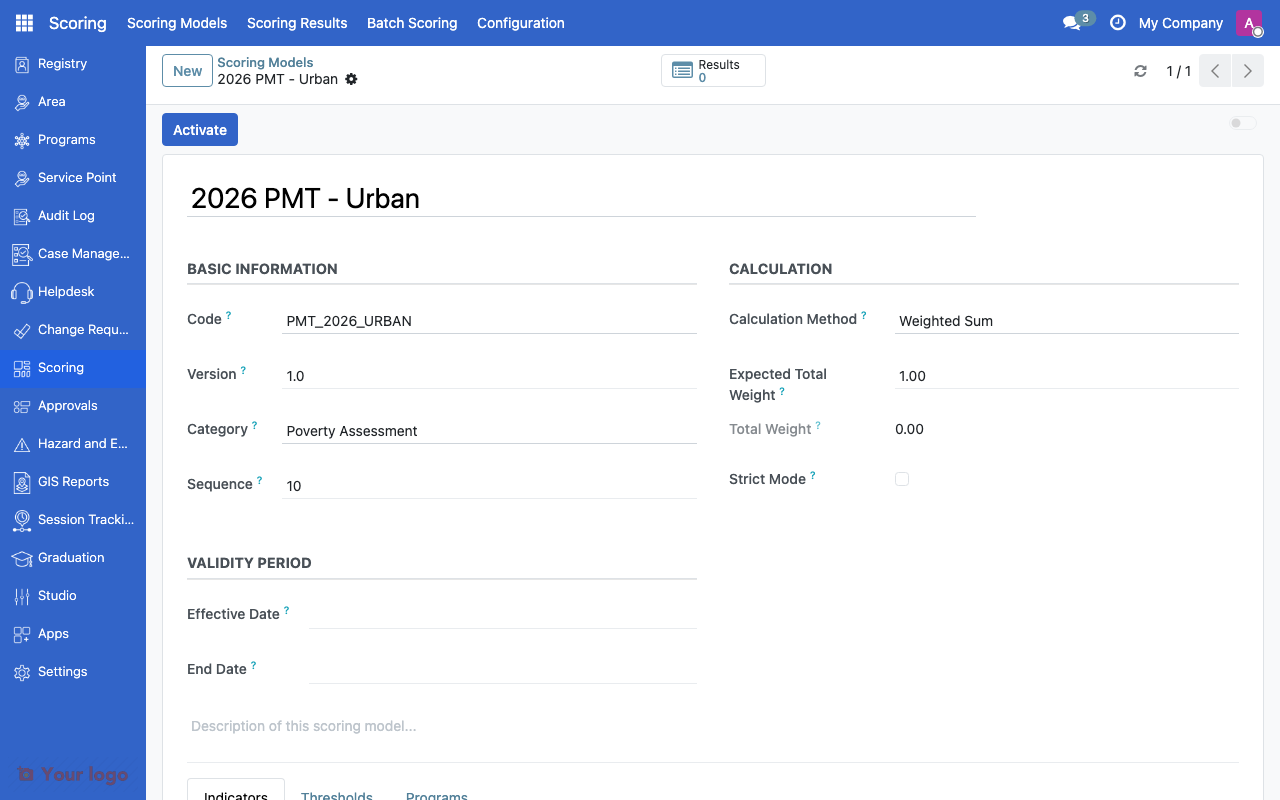
Scoring model form showing code, category, calculation method, and validity period.#
Location: Go to Scoring → Scoring Models to create one.
Step 2: Add Indicators#
Indicators are the building blocks. Each indicator maps to a household field and contributes to the total score.
Field |
What It Means |
|---|---|
Code |
Short name (e.g., "roof_material") |
Field Path |
Where to find data (e.g., "household.roof_material") |
Weight |
How much this indicator matters (0.0 to 1.0) |
Calculation Type |
How to score the value (direct, mapped, range) |
Required |
Fail if this field is missing? |
Example indicator:
Field |
Value |
|---|---|
Code |
roof_material |
Field Path |
household.roof_material |
Weight |
0.15 |
Calculation Type |
mapped |
Required |
Yes |
Step 3: Configure Value Mappings#
For categorical indicators (like "roof material"), you map each possible value to a score.
Example: Roof Material Scoring
Input Value |
Output Score |
Reasoning |
|---|---|---|
Concrete/metal |
0 |
Best quality = lowest poverty indicator |
Mixed materials |
5 |
Medium quality |
Wood/bamboo |
8 |
Light materials |
Salvaged/makeshift |
10 |
Poorest quality = highest poverty indicator |
Location: In the indicator form, add value mappings.
Step 4: Define Thresholds#
Thresholds classify households based on their total score.
Example: Poverty Classification
Min Score |
Max Score |
Classification Code |
Label |
|---|---|---|---|
0 |
30 |
NON_POOR |
Non-Poor |
30.01 |
50 |
NEAR_POOR |
Near Poor |
50.01 |
75 |
POOR |
Poor |
75.01 |
100 |
EXTREME_POOR |
Extremely Poor |
Location: In the scoring model form, add thresholds.
Step 5: Calculate Scores#
Once configured, you can:
Score individual households: Open a household record → Actions → Calculate Score
Batch score: Scoring → Actions → Batch Score Households (for large populations)
Calculation Methods#
OpenSPP supports different ways to calculate scores:
Method |
When to Use |
How It Works |
|---|---|---|
weighted_sum |
Most common, PMT-style |
|
cel_formula |
Complex formulas |
Use CEL expressions for custom calculations |
lookup_table |
Simple mapping |
Map household characteristics directly to scores |
external |
Third-party services |
Fetch scores from external APIs |
Weighted Sum Example#
If you have these indicators:
Roof material: score = 8, weight = 0.15 → weighted score = 1.2
Owns TV: score = 0 (no), weight = 0.10 → weighted score = 0
Household size: score = 5, weight = 0.10 → weighted score = 0.5
Total score = 1.2 + 0 + 0.5 = 1.7 (out of 10 possible)
Multiply by 10 if your thresholds are 0-100 scale.
Indicator Calculation Types#
When an indicator reads a field value, it needs to convert it to a number:
Type |
Use For |
Example |
|---|---|---|
direct |
Already numeric |
Age, income, household size → use value as-is |
mapped |
Categorical values |
Roof material, water source → lookup in value mappings |
range |
Continuous values with bands |
Income ranges (0-10k=10, 10k-20k=5, 20k+=0) |
formula |
Derived calculations |
Per capita income = household income ÷ member count |
Scoring Results#
After calculation, OpenSPP stores:
Score: The numeric result
Classification: The threshold category (e.g., "Poor")
Calculation Date: When it was calculated
Breakdown: How each indicator contributed (for transparency)
Input Snapshot: Field values used (for auditing)
Location: View results in Scoring → Scoring Results or on the household record.
Score Lifecycle#
Scores can become outdated when household data changes. Consider:
Scenario |
What to Do |
|---|---|
Annual assessment |
Schedule batch re-scoring once per year |
Data update |
Option to auto-recalculate when key fields change |
Model update |
Re-score all households with new model version |
On-demand |
User triggers recalculation for specific household |
Integration with Programs#
Scoring connects to program eligibility through the eligibility manager:
Configure scoring model (this section)
Create eligibility manager (see Eligibility rules)
Reference scoring model in eligibility criteria
Set required classifications (e.g., "POOR" or "EXTREMELY_POOR")
When program enrollment runs, it checks the latest score to determine eligibility.
Common Patterns#
Pattern 1: Simple Asset-Based PMT#
Use: Basic poverty targeting Indicators: 5-10 household asset and housing indicators Method: weighted_sum Thresholds: 3-4 poverty levels
Example: Philippines Listahanan-style
Pattern 2: Multi-Dimensional Vulnerability#
Use: Crisis response, disaster targeting Indicators: Multiple sub-indices (health, housing, economic, social) Method: weighted_sum of sub-scores Thresholds: High/Medium/Low vulnerability
Example: SWDI (Social Welfare Development Index)
Pattern 3: Hybrid Scoring#
Use: Combining quantitative and qualitative assessments Indicators: Household data + community validation scores Method: cel_formula for complex rules Thresholds: Program-specific classifications
Example: Food security programs with rapid assessment
Are You Stuck?#
Indicators not showing up? Make sure your scoring model is active and indicators are saved.
Scores not calculating? Check that required indicators have values in household records. View the calculation log for error details.
Classification shows "UNCLASSIFIED"? Your thresholds may not cover the full score range. Check that min/max values span all possible scores.
Weights don't add up to 1.0? That's okay! OpenSPP doesn't require weights to sum to 1. But for easier interpretation, consider normalizing them.
Need to test before going live? Create a test scoring model and try it on a few sample households first. Compare results to manual calculations.
Score changed but classification didn't? The score may have moved within the same threshold range. Check the threshold boundaries.
Security Considerations#
Control who can:
Create/modify scoring models: Restricted to program managers
View score breakdowns: May expose sensitive household data
Calculate scores: Available to field officers (but not modify models)
View classifications only: Frontline workers may only need to see "Poor" vs "Non-Poor"
Configure access rights in Settings → Users & Groups.
Next Steps#
Ready to configure specific scoring types?
Proxy Means Test (PMT) Configuration - Set up Proxy Means Test for poverty targeting
Vulnerability Scoring Configuration - Configure vulnerability assessment for emergencies
Social Welfare Development Index (SWDI) - Implement Social Welfare Development Index
Creating Custom Scoring Formulas - Build custom scoring formulas
See also:
Variables - CEL variables for formulas
Eligibility rules - Connecting scores to program eligibility