GIS configuration overview
Contents
GIS configuration overview#
This guide is for implementers setting up geographic visualization in OpenSPP. You should understand basic mapping concepts but don't need GIS expertise.
Mental model#
GIS in OpenSPP uses color schemes — centralized palettes that control how data is visualized on maps.
Key concepts#
Color schemes#
Centralized palettes for consistent visualization across all maps:
Field |
What it means |
|---|---|
Name |
Scheme label (e.g., "Poverty Scale") |
Code |
Unique identifier |
Scheme Type |
Sequential, Diverging, or Qualitative |
Colors |
List of colors used in the palette (selected via color picker) |
Default Steps |
Number of discrete color classes |
Color-blind Safe |
Accessibility flag |
Is Default |
System default scheme |
Scheme types#
Type |
When to use |
Example |
|---|---|---|
Sequential |
Values from low to high |
Poverty rate (light → dark) |
Diverging |
Values with a meaningful midpoint |
Change from baseline (red ← neutral → green) |
Qualitative |
Categories without ordering |
Program types (distinct colors) |
Navigation#
Menu |
Purpose |
|---|---|
Settings > GIS Configuration > Color Schemes |
Manage color palettes |
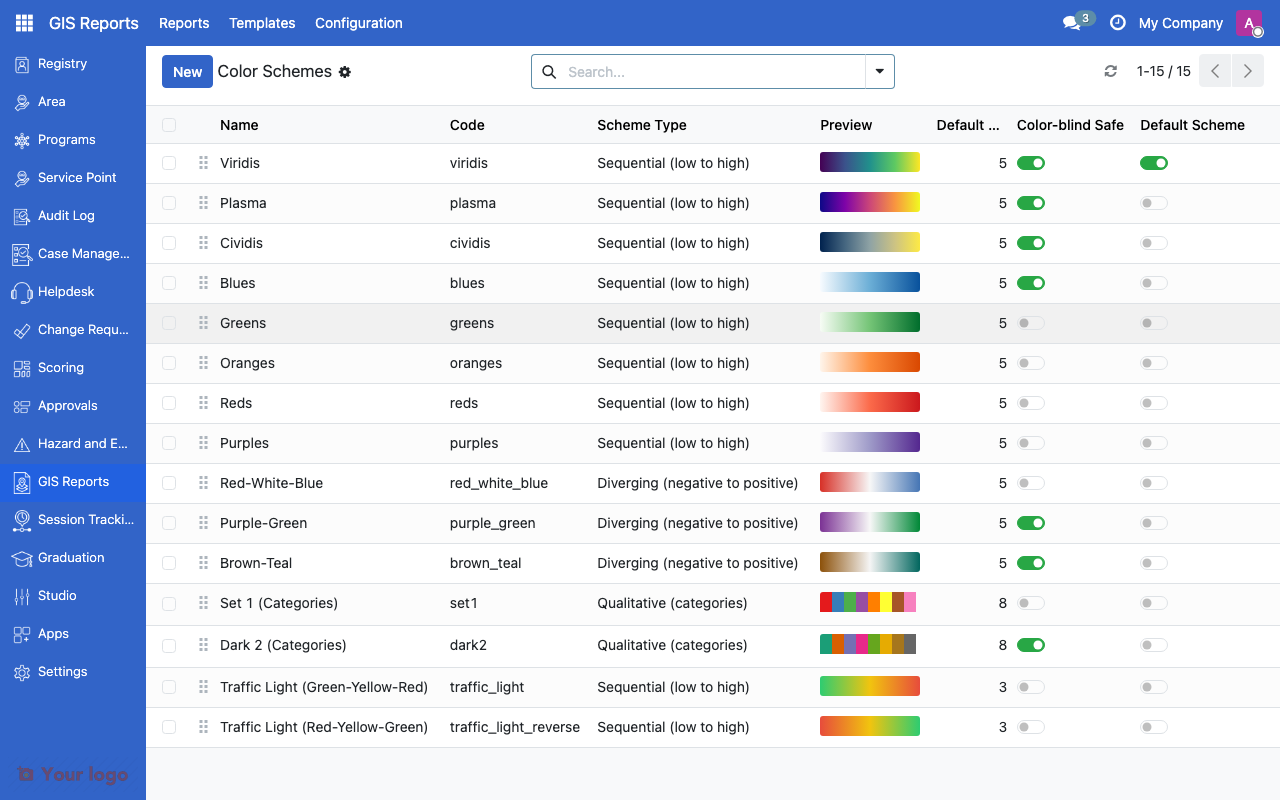
GIS color schemes list showing available palettes.#
Are You Stuck?#
Maps not loading?
The GIS feature requires special database extensions. Ask your system administrator to verify that the GIS module is installed and that geographic extensions are enabled on the database.
Color scheme looks wrong?
Check that the scheme type matches your data. Sequential for ordered values, diverging for values around a midpoint, qualitative for categories.
Next steps#
GIS reports and indicator layers - Set up GIS reports
Area management overview - Configure areas for GIS visualization